
H2O Driverless AI: The Workbench for Data Science


This blog was written by Rohan Gupta and originally published here.
1. Introduction
In today’s world, being a Data Scientist is not limited to those without technical knowledge. While it is recommended and sometimes important to know a little bit of code, you can get by with just intuitive knowledge. Especially if you’re on H2O’s Driverless AI platform.
If you haven’t heard of H2O.ai, it is the company that created the open-source machine learning platform, H2O, which is used by many in the Fortune 500. H2O aims at creating efficiency-driven machine learning environments by leveraging its user-friendly interface and modular capabilities.
Note : Don’t confuse the open-source H2O AI platform with the Driverless AI. They are two separate things. I suggest reading through the documentation on each to learn more.
H2O 3 (open-source) is a free library on python/R that contains many ML algorithms, models and tuning features that make machine learning more efficient.
The Driverless AI, on the other hand, is an enterprise product that has its own platform, UI and UX. It is like a web application that can be used to create and configure models using knobs and other visual apparatus that tune parameters, essentially replacing the tedious process of actually coding your model.
The H2O DAI can build and validate AI models from scratch and the only thing required is your dataset. The data doesn’t even have to be cleaned or feature-engineered as the H2O DAI is built to handle those tasks and allows you to configure the automation of important steps such as feature scaling or applying categorical encoding on variables.
Without further ado, I will begin the H2O Driverless AI tutorial.
2. Installation
H2O Driverless AI is an enterprise product and therefore isn’t recommended for an individual to purchase. Instead, your firm should deploy H2O locally and allow employees to take advantage of its robust interface.
However, you and I are individuals and for the purpose of this tutorial, I am using H2O’s 21-day free trial . You can do the same if you want to follow along and are not ready to purchase the product yet.
Note: There are some requirements for running h2o on your machine. It is recommended that you run h2o on Linux or Windows, however, you can run it on a Mac using docker. You can learn how to do that here . I will go through the requirements for Windows since that’s what I’m using for this tutorial. If you’re on Linux (prod. environment recommended), follow these instructions .
Start by visiting h2o.ai . Look for the Driverless AI product, fill out the form and download the latest stable version of the Driverless AI DEB .

On Windows, there are 2 additional requirements:
- Windows subsystems for Linux (WSL) must be enabled as specified at https://docs.microsoft.com/en-us/windows/wsl/install-win10
- Ubuntu 18.04 from the Windows Store. (Note that Ubuntu 16.04 for WSL is no longer supported.)
So, you need to first install Ubuntu 18.04 for WSL (which you can activate if you “run as admin” (Instruction in the first link). Once that’s done, run the following commands in Ubuntu 18.04 LTS to install and run H2O-DAI:
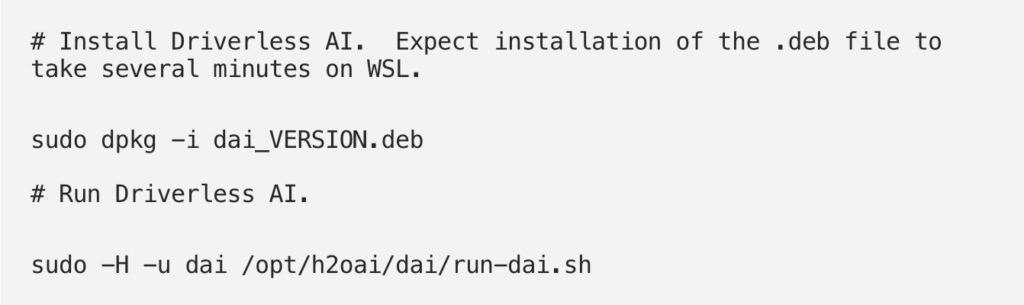
Another way to install H2O-DAI on windows is through Docker. You can find specific instructions for that here .
3. Launch H2O Driverless AI
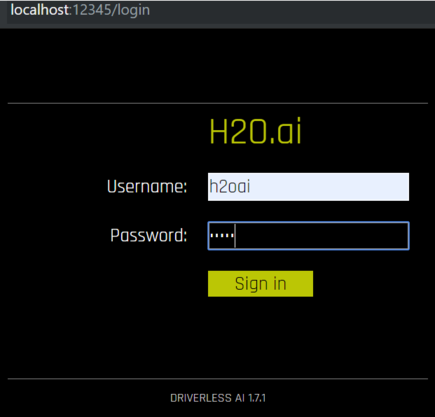
Get on your browser and in the URL box, type the following localhost:12345
This should work if you installed H2O on a local machine. The general syntax for running an instance is <server>:12345
Use ‘localhost’ on a local server. It should then automatically launch the login page, which will look like this.
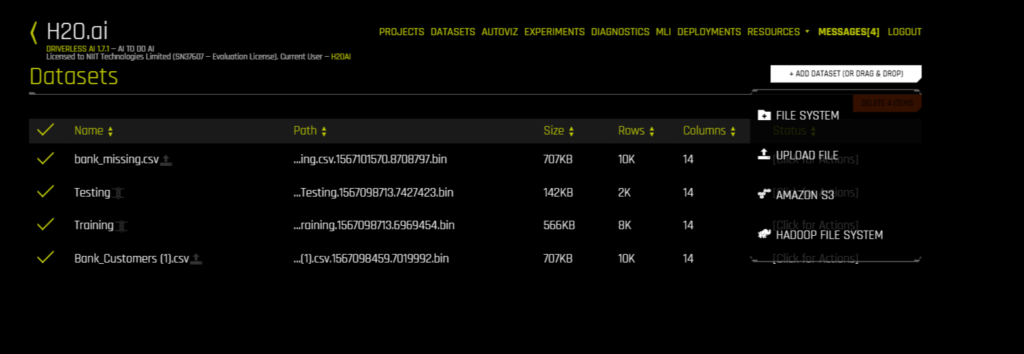
For Trial Users, the login ID and password are both “h2oai”. Log in the details and click sign in. You should now see the Datasets page, wherein H2O will show you any past-uploaded data or other files stored on the system.
4. Uploading data
H2O Driverless AI is very flexible when it comes to sourcing your data sets. Since a majority of its applications are on real-time/series data, H2O has the ability to extract information from a number of sources such as an Amazon S3 server, Hadoop file system, via Local upload, or the H2O file system.
I uploaded a file from my computer, which is the Telco Customer Churn Database (from Kaggle). This file contains customer data, with each column (except customer ID) factoring in on the churn prediction
5. AutoViz
As soon as my data set was uploaded, I could access the Autoviz tab. When you visualize a data set through Autoviz, it will give you different kinds of possible plots to summarize your data. All you have to do is upload your data, and Autoviz will be ready to use.
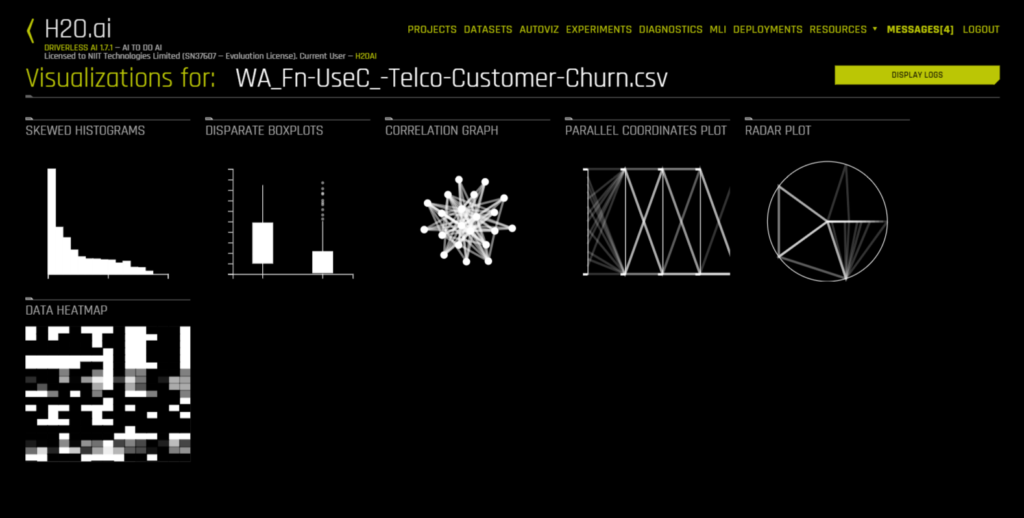
Some graphs are also interactive and can be moved around like in Plotly. All visuals are downloadable, so you can save them on your server or in a file system.
6. Projects
To start any experiment or activity, you need to have a project. So go on the Project tab and it should look like this:
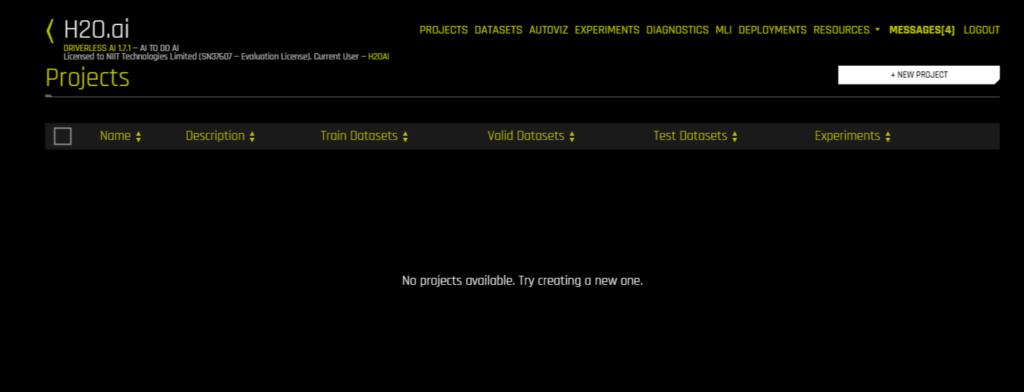
You’ll now want to create a new project, just pick a name and description to start with. Once that’s done, you’ll have a screen like the one right below. This is where you manage your project, its data, and experiments.
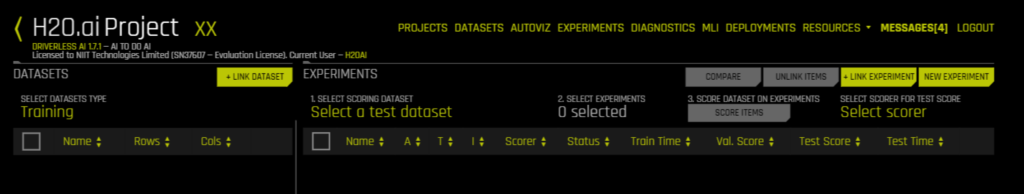
Use the Link Dataset button to link your files to this project. I’ve attached my data set on Customer Churn and it shows up under Training on the left side. If I right-click my dataset, I have the option of splitting it. I would need to split the dataset for training and testing, so I click Split and get the following options:
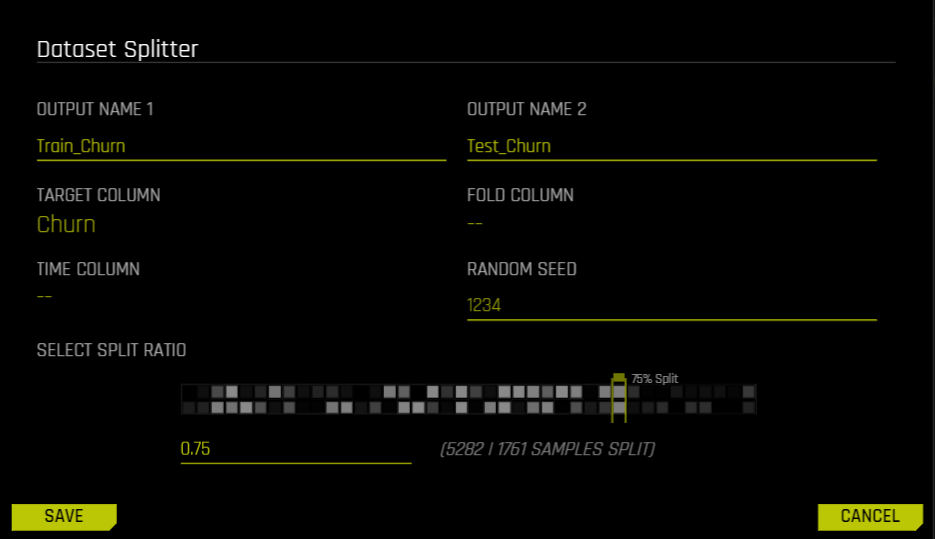
I choose the names of the two different data sets, pick a Target column (The column we want to predict), folds and time-columns if necessary, and select the split ratio. I picked 0.75 since that would give me 2500 values in my test set, which is enough to test the model on.
7. Experiments
Every time you run a particular model on a data set, it’s called an experiment. H2O makes the process of model selection much easier with this feature. You can use multiple experiments to pick the right model. Go to your Project’s dashboard and click New Experiment.
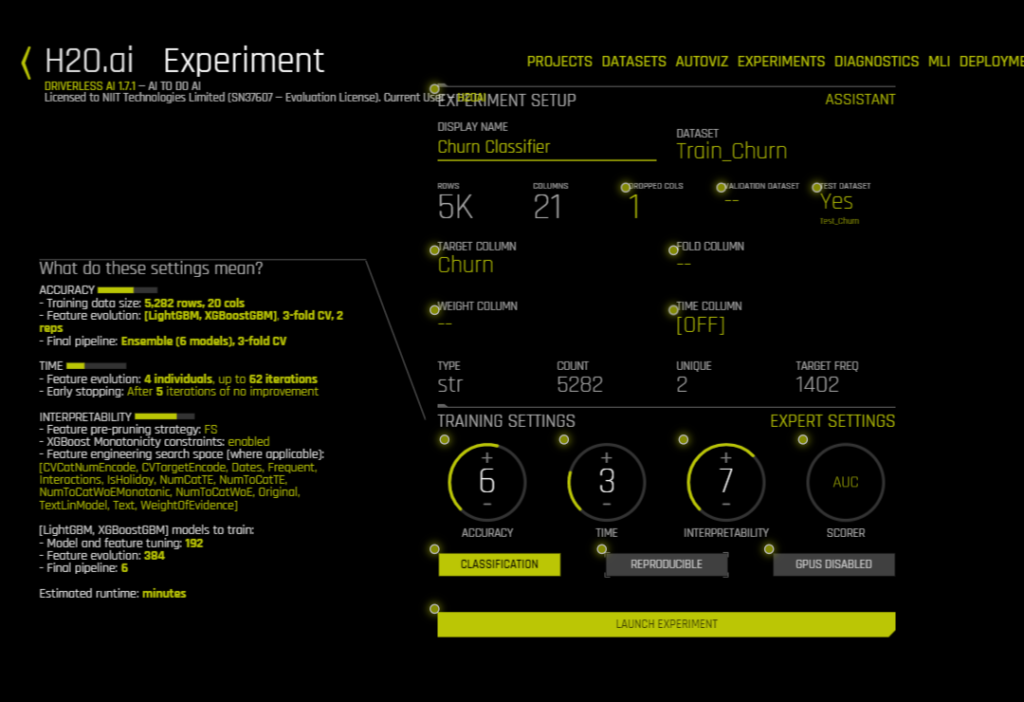
The Experiment Setup Assistant should open up. You can now start filling in the details of this experiment. Start with the name, then choose the training set. More details will show up (as you see in the GIF above). You can now select your Target Column, your test data set and you can change the training settings according to your needs. A personalized description of the model, according to the settings you’ve picked, will show up on the left side of the screen. You can even click on Expert Settings to go in deeper and change other parameters.
Once you click on Launch Experiment, a new screen will come up. You’ll see something like this and if you do, it just means that H2O is running your experiment — LIVE!
As the experiment moves along, it will start showing the model’s iteration data, as well as the most important variables (which may change as the model progresses). On the bottom right, you can also switch between screens to see:
~ ROC curve
~ Precision-Recall
~ Gain/Lift charts
~ K-S test chart (Kolmogorov-Smirnov)
~ CPU Usage.
Once your experiment is completed you should be able to see a screen like this and your CPU Usage tab would have changed to Summary:
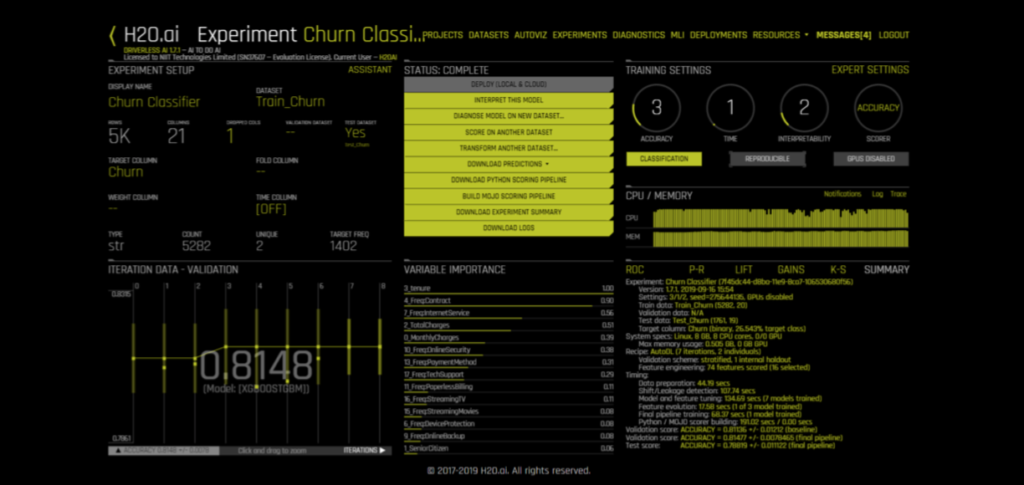
Right above variable importance, there is a menu of actions you can choose from. The only option unavailable on the screen is Deploy. There’s a reason for that. It’s because we haven’t downloaded our MOJO/POJO files yet. We’ll do that towards the end. First, let’s interpret this model.
8. Interpret the model
Navigate back to the Experiment tab and find your experiment. Open it up once again and click on the button that says Interpret This Model. The interpretation window will start loading and might take some time. It should look like this:

Once the interpretation page is loaded to 100%, you will get a menu for interpreting the model. This page can also be accessed via the MLI tab.
There a number of tabs on the left side of the page, as you can see in the GIFs below.
- Summary: Gives us an overview of the MLI (Machine Learning Interpreter) with some parameters of the model such as its most important variables with definitions, the number of LIME clusters used, a summary of the surrogate model. The GIF below shows a sample Summary page:

- DAI Model: Here you can see the model developed by the Driverless AI. Within the DAI Model, you can see a full picture of the feature importance within this model, each variable has its explanation pop up when you hover over the variable. It can also show you a Partial Dependence plot over the contract variable, and moreover, you can see the Disparate Impact Analysis with a full confusion matrix from our experiment.
- Surrogate Models: Apart from the DAI model analytics, we also get information about our Surrogate models. These are in the Surrogate tab, and allow us to see parameters and data from our other models such as the K-Lime clusters, Decision Tree model, and Random Forest Models.
Within Random Forest, we can also see Feature Importance, Partial Dependence, and LOCO. - Dashboard: Below is what the MLI Dashboard looks like. It contains all our important graphs and parameters on one page, so we can quickly navigate to where we want.

9. Diagnostics
The Diagnostics tab contains a page with certain accuracy metrics and graphs that can be used to diagnose the model after an experiment is run. It contains everything from the ROC Curve, Precision-Recall Curve, Gains/Lifts, K-S Chart, and Confusion Matrix with True/False Positive/Negatives.
Here’s what the diagnostics page looks like:

10. Deployments
As I had mentioned above, deploy was not possible because we didn’t have our MOJO file. To deploy your model locally or on a cloud server, you would first need to create the MOJO file. According to their website, “H2O-generated MOJO and POJO models are intended to be easily embeddable in any Java environment.”
So go back to the Experiments tab and load your experiment. You’ll see the menu again with option buttons in green. Go ahead and click the button that says Build MOJO Scoring Pipeline. It will now show you the screen to your left and will start building your MOJO pipeline.
Once you have your MOJO Pipeline available, you will have the option to Deploy your model. You can choose to put it on an Amazon Lambda server or you can use the REST API Server. Once you’ve chosen your destination, H2O ill automatically deploy your model and give you its location.

11. Resources and Conclusion
The resources tab has a number of options too. Firstly, it will have an option to take you to the Driverless AI documentation. It also contains links to download the H2O Driverless AI client APIs for R and Python. This is super useful if you want to learn more about the capabilities of Driverless AI and use it within your business.
In conclusion, I just want to mention that I am in no way associated with the Company H2O, that developed this product. I am a user of their products who thought it would be a good idea to post this tutorial since there aren’t many out there currently. It took me a while to learn H2O Driverless AI and I thought I would make it easier for others through this tutorial.
Feel free to comment on this post and ask me any questions about my work, or how I plan on using H2O in my personal/work projects. I might write another post in the future comparing Driverless AI to the H2O 3 (Open-source), and any feedback towards that would be great.
Thanks for reading. I hope this was able to help you in ways unimaginable.
For more information and tutorials on H2O Driverless AI, visit h2o.ai .