

At the Bay Area R User Group in February I presented progress in big-join in H2O which is based on the algorithm in R’s data.table package. The presentation had two goals: i) describe one test in great detail so everyone understands what is being tested so they can judge if it is relevant to them or not; and ii) show how it scales with data size and number of nodes.
These were the final two slides :
I left a blank for 1e10 (10 billion high cardinality rows joined with 10 billion high cardinality rows returning 10 billion high cardinality rows) because it didn’t work at that time. Although each node has 256GB RAM (and 32 cores) the 10 billion row test involves joining two 10 billion row tables (each 200GB) and returning a third table (also ~10 billion rows) of 300GB, total 700GB. I was giving 200GB to each of the 4 H2O nodes (to leave 50GB on each node for the operating system and my forgiving colleagues) which meant the H2O cluster had 800GB RAM. The join algorithm needed more than a mere 100GB to complete the task and hence failed. Given that a common rule of thumb is “3x data size” for working memory, to fail with 0.1x data size as working memory is very reasonable. Internally we refer to H2O as a fast calculator . Like R and Python it is in-memory. Unlike R and Python a single data frame can be bigger than a single node.
So I scaled up to 10 nodes: 2TB RAM and 320 cores.
But it still didn’t work. It ran for 30 minutes and then failed with out-of-memory. I felt that 2TB of RAM really should be enough to complete this task: 200GB joined with 200GB returning 300GB. 2TB-700GB = 1.3TB; that amount of working memory should be enough. It pointed to something being wrong somewhere. Indeed with help from colleagues we identified one point where data was being duplicated and shouldn’t have been. This reduced the working memory needed and then it worked.
But it took 20 minutes.
This didn’t fit with my gut feel given I knew how the algorithm works (or was supposed to work). It should be nearer to linear scaling. 1 billion rows took under a minute so 10 billion should take 10 minutes. But it was taking twice that: 20 minutes. More to the point I’m not just having a cup of coffee or lunch while it’s running; I’m watching the CPUs and the network traffic between the nodes. The puzzling thing was that the network wasn’t saturated and the CPU’s were often cold. Something was wrong .
There ensued many proposals and discussions as to what it might be. Focusing on the algorithm and its implementation.
Until one day I went back to the 1 billion row test and ran it on 4 nodes, but a different set of 4 nodes. I usually run on servers 6-9. There was no reason for picking those servers. The first time I did it I asked which ones I could use and then never changed it. This time I ran on servers 1-4 instead. It was 3 times slower. At first I thought there must be a difference in the libraries on the servers or my code. After ruling out many things I rubbed my eyes and ran it again a few times again and then again on servers 6-9. It was repeatable and confirmed. How on earth could it make a difference which servers I ran on? All 10 servers are identical spec in the same rack connected to the same switch. Here’s a photo :

I was monitoring CPU and network usage. Nothing else (either human or artificial) was using the cluster. I was the only one. I had this physical cluster to myself. For sure.
I realized we might have been barking up the wrong tree when we were looking at the algorithm and its implementation. When I scaled up to 10bn rows and 10 nodes, perhaps I didn’t just scale up as intended, but perhaps I included a server that was somehow, faulty ?!
I reran on servers 2-5 and it was 3 times faster than on servers 1-4. The culprit appears to be server 1, then. We have a network tester in H2O that I had already run but ran it again. Our server names correspond to the last digit of their IP addresses: server 1 = .181, server 2 = .182, server 3 = .183, etc. Here was the image :
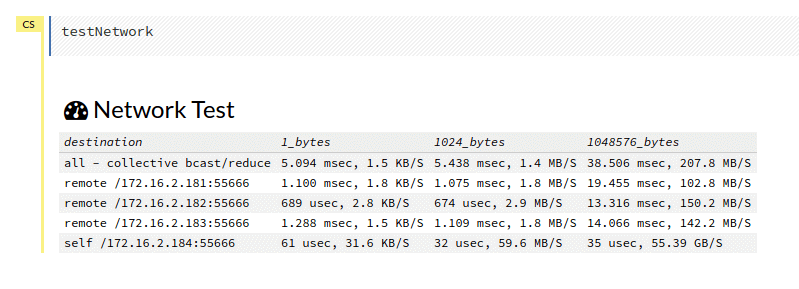
There doesn’t appear to be much wrong here. I asked colleagues and they advised to more thoroughly check the network speeds as they’d seen problems in the past. I Googled for how to test network speed which quickly returned iperf. I knew the problem might be server 1 so I chose server 3 to be the server and compared speeds from servers 1, 2 and 4 as clients to server 3 as the server. Here’s the result :
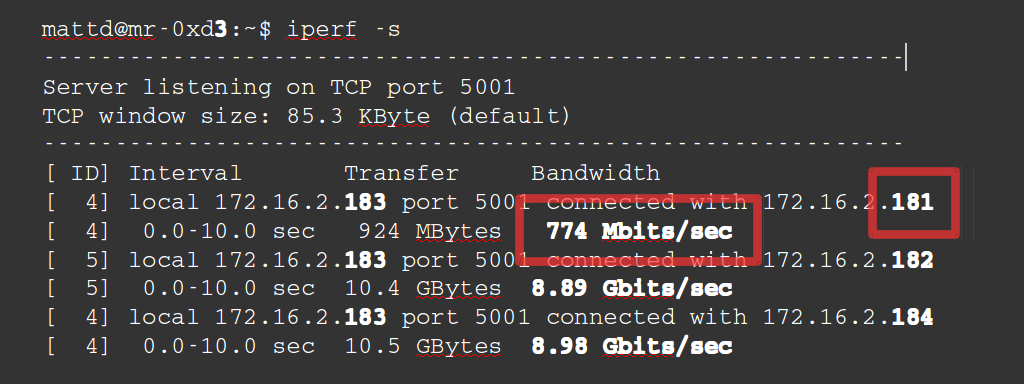
So server 1 is more than 10 times slower the others. I trotted over to our server room again and I had a look at the back of server 1.


See that orange light? That’s what was wrong. Either the switch or the network card had auto negotiated itself down to 1G speed when all its friends in the rack are happy at 10G speed. Despite it being up 57 days, it hadn’t auto-negotiated itself back up to 10G speed. Or something like that. We think.
What’s the solution? Old school: I unplugged the ethernet cable and plugged it back in. The orange light turned green. I went back to my laptop and tested again with iperf. This time iperf reported 10G speed for server 1 consistent with the other servers. The non-physical way to do this is to use ethtool . Next time a problem occurs I’ll try it to save some foot steps to the server room.
Rerunning the 10 billion row to 10 billion row high cardinality join test now comes in twice as fast: 10 minutes instead of 20 minutes. I’m not really sure why that made such a big difference since the network wasn’t saturated enough for it to be a pure data transfer speed issue. I’ll chalk it up to something to do with that network card or switch and move on. I’ll ensure that iperf reports 10G speed between all nodes going forward.
In my talk in Chicago this week I connected to these servers and gave a live demo . That video along with all our other presentations that day are available here .
The event itself was quite packed as seen in the picture below:

Big Joins, Scalable Data Munging and Data.Table
Matt Dowle, Hacker, H2O.ai
I’ll be presenting on the same topic at Data by the Bay on Monday 16 May.