Predicting Airline Data using a Generalized Linear Model (GLM)
Just recently I created a wiki post on the H2 O Github page with step by step directions on how to predict if a flight’s arrival would be delayed or not. I essentially uploaded airline data from the American Statistical Association to H2 O and used GLM (also known as generalized linear model , logistics regression, or logit regression) to predict “IsArrDelayed”. I have pasted snippets below, you can view the full source on Github here.
Hacking Airline Data Set with H2O Here is your data: Airline Dataset The data comes originally from RITA where it is described in detail. You can download the data there, or from the bzipped csv files listed below. These files have derivable variables removed, are packaged in yearly chunks and have been more heavily compressed than the originals.
You can play around with the following data sets. You can also download your data to imgyour local machine, EC2, Rackspace, HDFS, or S3
Airlines all years 1987-2008:
https://s3.amazonaws.com/h2o-airlines-unpacked/allyears.csv (12 GB)
Or if you want something bigger here is the 10x version:
https://s3.amazonaws.com/h2o-airlines-unpacked/allyears_10.csv (120 GB)
Or if you want to play with something smaller collection of 2000 rows from all years airline data set. For this example we will be using this this data set:
https://s3.amazonaws.com/h2o-airlines-unpacked/allyears2k.csv (4.5 MB)
GLM Model
Now that you have your data, lets use H2 O to run GLM on your data and make some predictions! In this example we will use H2 O to put together a model to predict if a flight will arrive on time. Look at the “IsArrDelayed” column/category, we will use the data we have to predict this column using GLM (Generalized Linear Model). First off, what is GLM? Some call it logistic regression , others call it logit regression. GLM functions work better if you know something about the distribution of the variables. By definition, “In statistics, the generalized linear model (GLM) is a flexible generalization of ordinary linear regression that allows for response variables that have other than a normal distribution. The GLM generalizes linear regression by allowing the linear model to be related to the response variable via a link function and by allowing the magnitude of the variance of each measurement to be a function of its predicted value.” (Wikipedia > GLM ) In short, its a good algorithm for predicting stuff. You can also get more info on The H2O GLM and its arguments here .
Lets start H2 O by following the simplified instructions below to get a model on our data in less than 5 minutes to predict if your flight arrival will be delayed or not. If you want more detail on multiple options like starting an H2 O cluster, launching with HDFS or S3 check out this wiki link: Start H2O from the command line
- Open your command line and run the H2O Jar:
Java -jar h2o-*.jar - Paste the H2O URL in your browser and your on the H2O home page. It should look something like:
http://192.168.1.76:54321 - Upload your data: Once H2O is running on your browser, click on the
Data -> Uploadto upload your data set Parse your data:Once your data is uploaded you will get a look at a sample of your data. Verify that your data has headers then submit to be parsed.- Once your data is parsed you will see the .hex file in a spread sheet which will point out the size along with number of rows and columns. Review the your data to decide what category/column you would like to predict and which to not include in model. Here is a screen shot of what your parsed data looks like…
- Choose your algorithm and build models: at the top ofthe page you will have 4 choices for modeling. For this case pick GLM and begin at the H2O request GLM page
Y - What you want to predict:First pick your “Y” which is the category/column that you want to predict. In this case we are using “IsArrDelayed” as our “Y” to predict if the arrival of a flight would be delayed.X - What you want to ignore:Next pick the categories/columns you want H2O to ignore in its analysis, “X”. In this case we want to look for the things that are not available to a traveler for more than 24 hours in advance of buying a ticket so they can predict “is my flight going to be delayed?”. We want to ignore “ActualElapsedTime”, “ArrDelay”, “DepDelay”, “Canceled”, “Diverted”, “IsDepDelayed”. Why? Well, “ActualElapsedTime”, “Canceled”, and “Diverted” we would not know. And with “ArrDelay”, “DepDelay”, and “IsDepDelayed”, H2O can use the data in these categories to make an exact prediction (AUC =.99999). Math is smart! “CancelationCode” is defaulted to be ignored by H2O since it has a lot of NAs.Pick Your FamilyIn this case we are picking Binomial since our answer is 0 or 1, delayed or on time.Link:In this example we pick logit (logit regression) since its a boolean logical 0 or 1 which is due to us picking binomial.Alpha and Lamda:H2O defaults to a small Alpha (.5) and a large Lambda. This is so that the coefficients that are bad predictors go to zero so you can find a subset of columns that are your best predictors. Basically, it makes your model generalize better.Folds:how many folds of cross validation? Run 10 since its not a big data set and the performance is reasonable. For a small data set you can essentially set the number of folds to the number or rows to get more cross validation which typically isn’t useful beyond 10 or so for large data sets.- Run GLM by clicking
SubmitBelow is a screen shot of what the output looks like. Review your equation and your coefficients


Scroll down to review your AUC, confusion matrix , and your 10 fold cross validation.

Review Your Model
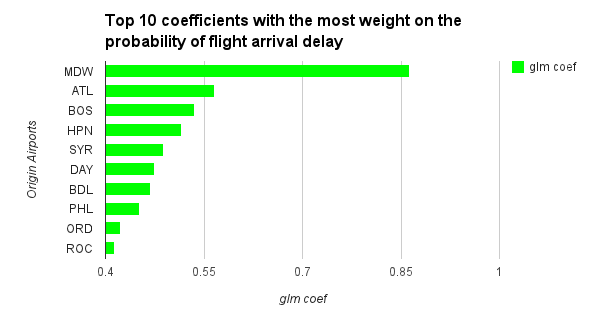
You can see how long it took for H2 O to run your model, your coefficients, and your AUC. Once you study the coefficients you can see which affect your accuracy. When looking at the coefficients for which ones matter, look at the “normalized coefficients” – which are scaled to the same level. Otherwise columns with large values (such as e.g. 5000 miles traveled) look “more important” than columns with small values (such as 0 or 1 for SFO or not-SFO). In this case for example, Dest.SFO has a coefficient of ~0.282930 which is quite high and means that when your destination is SFO your chances of a delayed arrival flight are higher. If you live in the SF Bay Area, you are aware of this as I am sure you have experienced multiple weather delays due to fog while landing into SFO. Same with Dest.SEA (~0.38255) and Origin.ATL (~0.5666). I personally was delayed multiple times flying out of Atlanta (ATL).