


Responsible AI Overview
FROM EXPLAINABILITY TO RESPONSIBILITY
Background
Responsible AI is the natural next step of Explainable AI and incorporates best practices for people and process as well as the technology. Beyond regulatory compliance, companies deploying machine learning in production have real business interests in understanding their models and trusting that models will perform as expected and that models are not discriminatory. H2O Driverless AI, an industry leading automatic machine learning platform, provides multiple visualizations and mathematical methods for explaining machine learning models and testing them for discrimination and instability.
To understand, it is important to delineate between some key terms. Explainable AI (XAI) is the ability to explain a model after it has been developed. Machine learning Interpretability refers to transparent model architectures and increasing how intuitive and understandable ML models can be. Disparate impact analysis is an Ethical AI technique that enables users to test whether demographic groups are being treated differently by a model, and sensitivity analysis is a model governance approach that allows users to test a model under interesting conditions, such as a simulated recession or natural disaster. Each piece of this functionality is a critical pillar of Responsible AI.
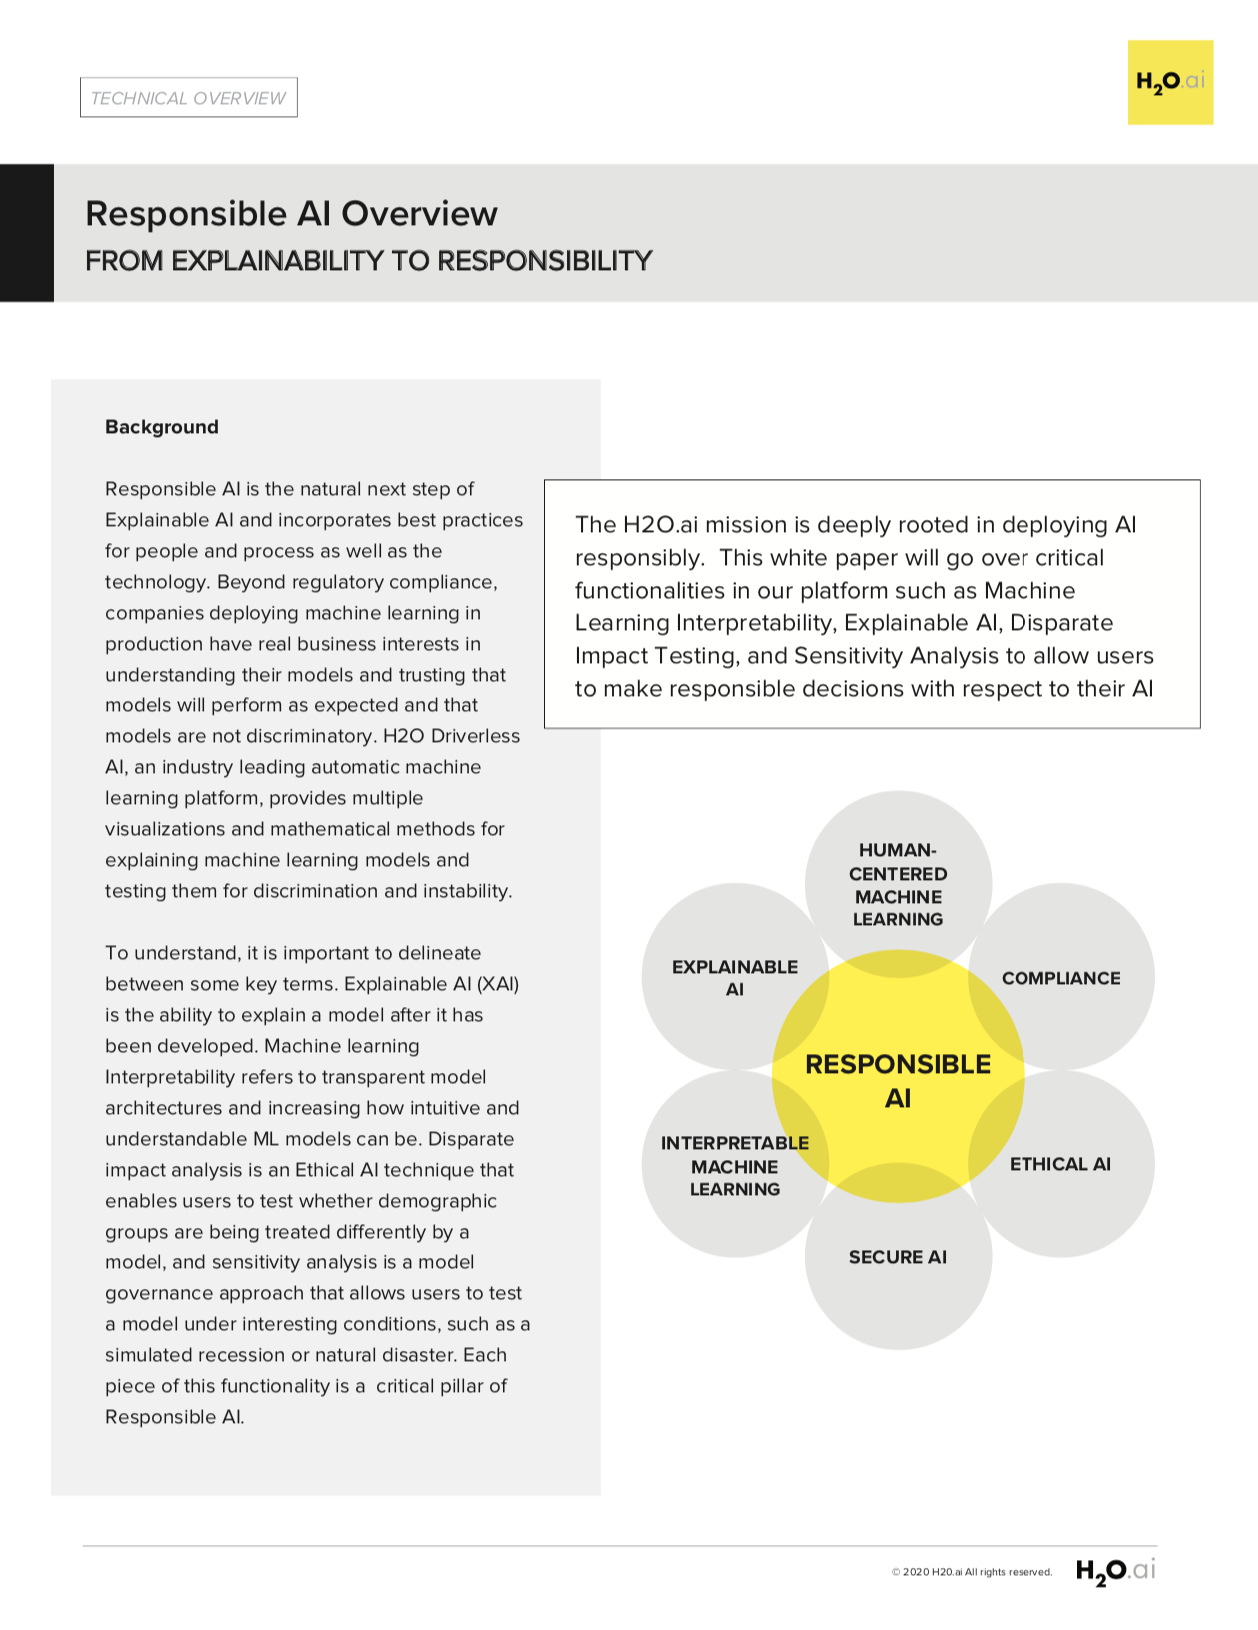
Responsible AI
The H2O.ai mission is deeply rooted in deploying AI responsibly. This whitepaper will go over critical functionalities in our platform such as Machine Learning Interpretability, Explainable AI, Disparate Impact Testing, and Sensitivity Analysis to allow users to make responsible decisions with respect to their AI.

Why Does it Matter?
H2O Driverless AI provides market leading responsible AI technology methodologies to address questions associated with trust and understanding in machine learning. The interpretable models and XAI components of Driverless AI enables the data practitioner to get clear and concise explanations of the model results by generating multiple dynamic metrics and visualizations into a dashboard, these interactive charts can be used to visualize and debug a model by comparing the displayed global and local model decision-process, important variables, and important interactions to known standards, domain knowledge, and reasonable expectations. Disparate impact and sensitivity analysis enable users to test models for discrimination and instability problems, respectively.
Bringing AI To Enterprise
Business Needs:
Responsible AI facilitates the business adoption of machine learning by:
- Enhancing understanding of complex model mechanisms
- Mitigating risk of deploying black-box models at scale
- Providing deeper insights into patterns and behavior in your data
- Increasing trust that models are stable
- Facilitating fairness by automatically testing for discrimination
- Assisting with regulatory compliance
Benefits
- Automatically generates numerous charts and measurements for model debugging
- Near complete transparency & accountability for model mechanisms, predictions, and decisions
- Smart data visualization techniques portray high dimensional feature interactions in just two dimensions
- Reason codes in plain English, for easy understanding and potential regulatory compliance
- Understanding feature importance globally vs. locally
- Increased insight into how sensitive your models are to data drift & isolated data changes
- Visually displaying the highest and lowest probability prediction paths with decision trees
- Clear alerts for detected discrimination across multiple measures
- Simulation and explanation by engaging a model with what-if analysis
K-LIME
K-LIME automatically builds linear model approximations to regions of complex models’ learned response functions. These simple penalized GLM surrogates are trained to model the complex predictions of the Driverless AI Model, and can be used to generate reason codes and English language explanations of complex Driverless AI models.


Variable/Feature Importance
Variable importance quantitatively measures the effect that an input variable has on the predictions of a model. Driverless AI presents both global and local, row-level variable importance values to tell users the most influential variables, and the variables’ relative rank, in a model and in each decision. Techniques such as Decision Trees and Shapley Values are used to calculate local variable importance.
Decision Tree Surrogate
The decision tree surrogate model provides insight into the Driverless AI model by displaying an approximate, overall flow-chart of the model’s decision-making process. It also displays the most important variables and interactions in the Driverless AI model. Combined together with the partial dependence and ICE plots, these visualizations enable the understanding of complex, high-degree variable interactions with just two-dimensional plots.


Partial Dependence and ICE Plots
The partial dependence plot shows the estimated average effect of changing one variable on the model prediction. Partial dependence plots are global in terms of the rows of a data set, but local in terms of the input variables. ICE plots can provide an even more local view of the model’s decision-making process. An input variable in a single row is selected then that input variable is toggled through the set of values for the input variable in the training data set, and then run through the model again for each value to display a range of possible predictions for rows similar to the selected row. Combined together with the decision tree surrogate plot, these visualizations enable the understanding of complex, high-degree variable interactions with just two-dimensional plots.
Disparate Impact Analysis
When the discussion of ‘fairness’ or ‘ethical AI’ comes up, one of the most accepted methodologies for vetting this fairness is Disparate Impact Analysis. Disparate Impact Analysis is sometimes also called Adverse Impact Analysis is a way to measure quantitatively the adverse treatment of protected classes, which leads to discrimination in hiring, housing, etc., or in general any public policy decisions. Regulatory agencies will generally regard a selection rate for any group which is less than four-fifths (4/5) or eighty percent of the rate for the group with the highest selection rate as constituting evidence of adverse impact. This common threshold is used to flag discrimination automatically in Driverless AI models.


Shapely Values
Global Shapley feature importance provides an accurate overall view of the drivers of your model’s predictions. Global Shapley values are reported for original features and any feature the Driverless AI system creates on its own. Driverless AI provides both global and local Shapley values.
Global Shapley values shows:
- The average numerical impact of original features and features the Driverless AI system derived on its own that are used in the final Driverless AI model predictions lower on average.
Local Shapley feature importance shows:
- How each feature directly impacts each individual row’s prediction.
Local Shapley values:
- Are similar to global Shapley values but show the numeric impact of each feature for each Driverless AI model prediction
- Are accurate, consistent, and likely suitable for creating reason codes and adverse action codes
- Always add up to the model prediction
Sensitivity Analysis/What-if
Sensitivity analysis, sometimes called “what-if?” analysis is a mainstay of model debugging. It’s a very simple and powerful idea: simulate data that you find interesting and see what a model predicts for that data. Because ML models can react in very surprising ways to data they’ve never seen before, it’s safest to test all of your ML models with sensitivity analysis.
Interpretation of External Models
Driverless AI is able to construct an explanatory dashboard for many external, 3rd party models (which have been uploaded with predictions) that includes global and local variable importance, partial dependence and ICE, surrogate decision trees, and k-LIME
Using AI to get Results Responsibly
AI is critical to business success. H2O Driverless AI makes getting AI results that can be explained, understood and trusted a real possibility from a technology standpoint. This is just one step in your company’s responsible AI journey which should also include people and processes as well. Contact H2O.ai for more details and how we can help at: sales@h2o.ai
